Table of Contents
- 1. Stop Wasting Your Life on Copy-Paste with Automated Scheduling
- Scheduled Delivery
- Dynamic Date Rolling
- Recipient-Specific Filtering
- 2. Tell the "Whole Story" with Cross-Channel Data
- Unified Performance Metrics
- Goal Tracking Comparison
- Live "Calculated" Insights (via Looker Studio)
- 3. Visualize Wins (Because Clients Don't Read Spreadsheets)
- Visual Rank Progression
- The Competitor "Cross-Over" Chart
- SERP Feature "Trophy Case"
- 4. White Labeling: The "Bigger Than You Are" Effect
- Brand Consistency
- The "From" Address Illusion (Custom SMTP)
- Client-Specific Co-Branding
- 5. Scale Efficiency with a Smart Template Strategy
- Scalable Template Management
- Service Tier Enforcement
- Frictionless Client Onboarding
- Real-Life Use Cases: What This Looks Like in Practice
- Scenario A: The "Local Franchise" Reporting
- Scenario B: The "Full-Stack" E-Commerce Agency
- Scenario C: The Two-Person Agency Scale-Up
- Final Thoughts: Report for Retention
Say a prayer for the account managers. The end of the month is approaching, and instead of strategizing for next quarter, they are stuck in "Excel Hell" — taking screenshots of Google Analytics, copy-pasting ranking tables, and trying to explain why traffic is down 2% without sounding defensive.
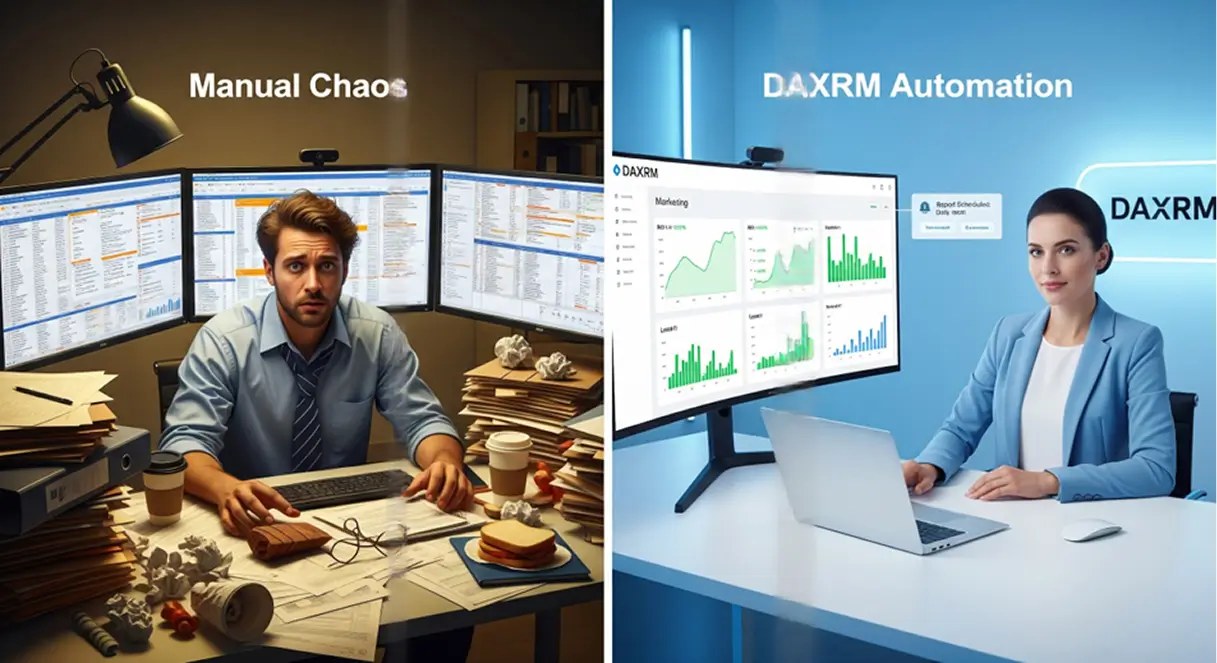
It’s the unscalable bottleneck of agency life. Marketing might bring in clients quickly, but you might lose them at the same speed if your reporting process is manual. You can’t add more clients with your team already drowning in reports.
Here is how using an automated, integrated reporting engine, like the one inside DAXRM, turns SEO reporting from a chore into a retention strategy.
1. Stop Wasting Your Life on Copy-Paste with Automated Scheduling
The average agency spends anywhere from 3 to 4 hours per client, per month, on reporting. If you have 20 clients, that’s 80 hours—literally two full weeks of work—burned on administrative tasks.
DAXRM’s Automated Scheduling allows you to build a report once and set it to recur. You choose the frequency—weekly for the neurotic client, monthly for the hands-off one—and the system generates and sends it.
Scheduled Delivery
You set the rules: "Send the Executive Summary on the 1st of every month at 9:00 AM." This consistency builds trust. It trains the client to expect results in their inbox before they even have a chance to ask, "What have you done for me lately?" It changes the dynamic from reactive (them chasing you) to proactive (you leading them).
Dynamic Date Rolling
Forget checking if you selected the right date range. DAXRM’s "Rolling Date" feature automatically updates every widget in your report to the correct period (e.g., "Last 30 Days" or "Month to Date") every time it sends. You never have to worry about accidentally sending a client data from two months ago because you forgot to click a dropdown.
Recipient-Specific Filtering
You don't have to send the same 50-page PDF to everyone. You can set up automation rules to send a high-level "Executive Summary" to the CEO while sending a detailed "Technical Breakdown" to their in-house developer—both pulled from the same data source, automatically filtered, and delivered to the right inbox without you lifting a finger.
2. Tell the "Whole Story" with Cross-Channel Data
Clients don't live in silos. They don't care that "Organic Traffic is up" if "Total Sales are down." The problem with most reporting tools is that they only show one piece of the puzzle. You send an SEO report, then a separate PPC report, and the client is left trying to do the math.
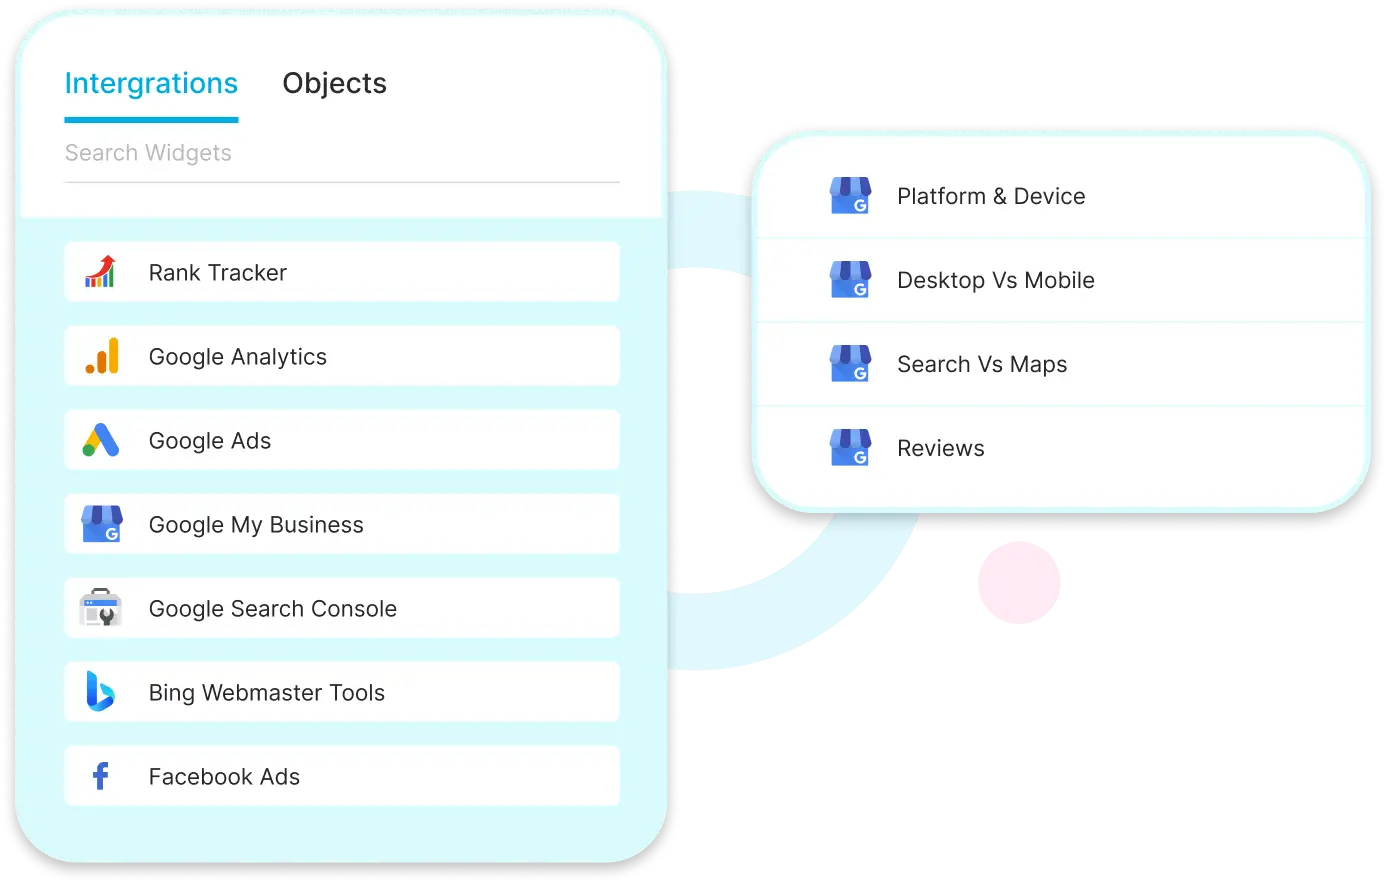
Your dashboard’s Drag-and-Drop Builder allows you to pull widgets from multiple data sources into a single narrative. You can place a Google Ads widget right next to a Google Search Console widget.
Unified Performance Metrics
This is where you connect the dots. You can show a client how your SEO efforts (ranking for "informational" keywords) are filling the top of the funnel, which is then retargeted by your Meta Ads to drive conversions. By visualizing these channels together, you move from being a "vendor" who fixes rankings to a "partner" who drives revenue.
Goal Tracking Comparison
Don't just show traffic; show targets. You can drag a "Goal Tracking" widget into your report that visualizes Actual vs. Target performance across channels side-by-side. Seeing that Google Ads is at 80% of its lead goal while SEO is at 120% helps you argue for budget shifts without needing a complex spreadsheet to prove it.
Live "Calculated" Insights (via Looker Studio)
For advanced clients, DAXRM’s Looker Studio connector allows you to create blended metrics that don't exist in standard tools—like "Total Cost Per Acquisition" (combining Meta Spend + Google Ads Spend / Total Leads). This gives the client the "One Number" they actually care about, proving your agency’s efficiency across the entire marketing mix.
3. Visualize Wins (Because Clients Don't Read Spreadsheets)
If you send a client a CSV file of keyword rankings, you have lost them. They don't know what to look at. They need visuals.
Using data from the Rank Tracker and Local Rank Tracker, you can embed visual proofs directly into the report. For local clients, this is a game-changer. Instead of a list of numbers, you can embed the Geo-Grid snapshot we talked about in previous posts.
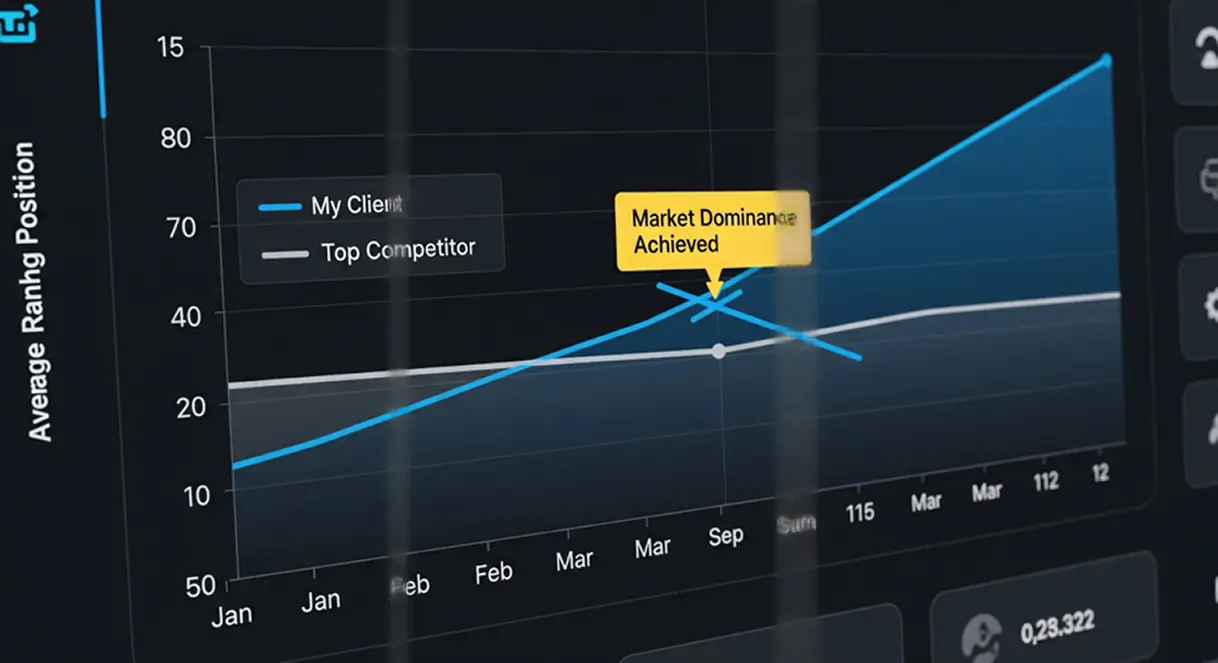
Visual Rank Progression
A line graph going up and to the right is the most powerful psychological tool in your arsenal. DAXRM allows you to visualize historical ranking data over the last 12 months. Even if rankings dipped slightly this week, showing the client a 12-month trend line proving they are up 40% year-over-year silences panic and reinforces the long-term strategy.
The Competitor "Cross-Over" Chart
Nothing motivates a client like beating a rival. You can overlay a key competitor's ranking history directly onto your client's graph. The moment your client’s trend line crosses above their competitor’s line creates a compelling "drop the mic" visual that validates your entire campaign without you saying a word.
SERP Feature "Trophy Case"
Your reports can visually highlight which specific SERP features you’ve captured—like the "Featured Snippet" (Position Zero), "People Also Ask" boxes, or "Video Carousels." It shifts the conversation from "Where do we rank?" to "Look how much of the screen we dominate." Modern SEO is about the real estate you occupy, not just blue links.
4. White Labeling: The "Bigger Than You Are" Effect
Perception is reality. If you are charging premium retainer fees, sending a generic PDF with a software company's logo on it feels cheap. It reminds the client that you are just using tools they could buy themselves.
White Labeling allows you to fully rebrand the experience. You aren't just slapping a logo on a PDF; you are hosting the data on your own custom domain (e.g., portal.youragency.com).
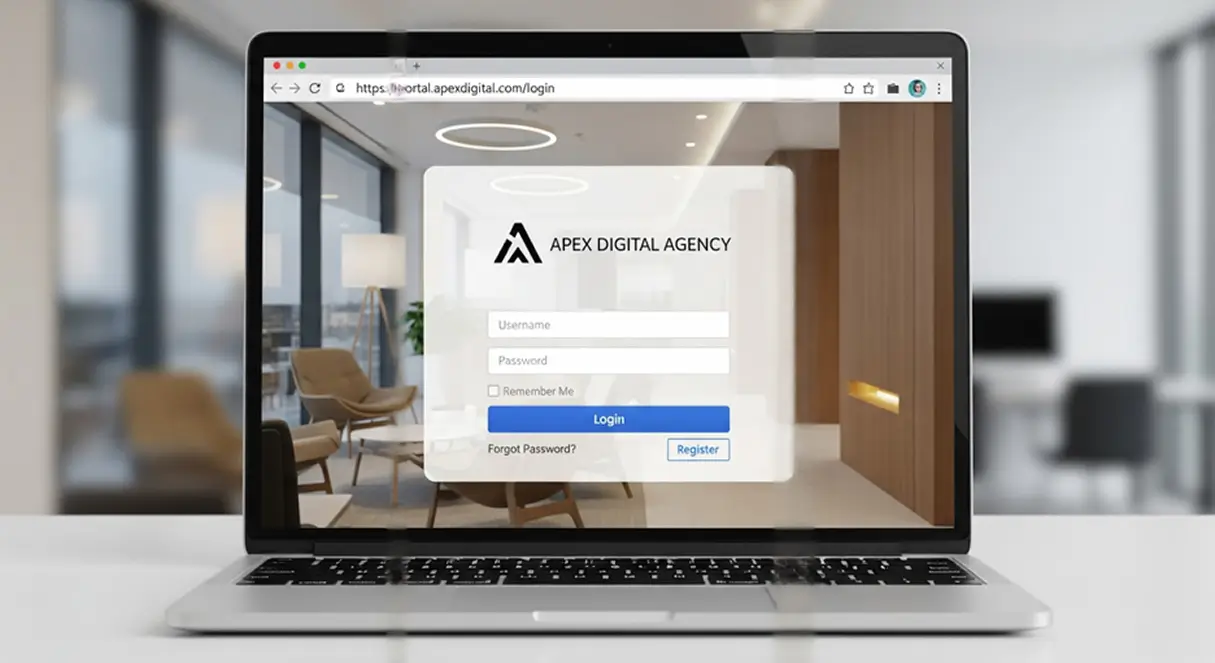
Brand Consistency
When a client logs into a dashboard that carries your agency’s colors, logo, and URL, it creates "stickiness." It makes your agency feel like a tech-enabled enterprise rather than a freelancer with a subscription. This added layer of professionalism is often the difference between a client negotiating your fees down or accepting them as the standard for a premium service.
The "From" Address Illusion (Custom SMTP)
The spell is broken the moment a client sees an email come from noreply@software-provider.com. DAXRM allows you to configure Custom SMTP settings, ensuring that every automated report lands in their inbox coming directly from reports@youragency.com. It guarantees that your brand is the only thing they see, from the subject line to the footer.
Client-Specific Co-Branding
Make the report feel like it belongs to them, not just you. The builder allows you to inject the client’s specific logo alongside your own on the cover page. This subtle psychological tweak shifts the report from looking like "marketing spam" to looking like an internal, strategic document tailored specifically for their business.
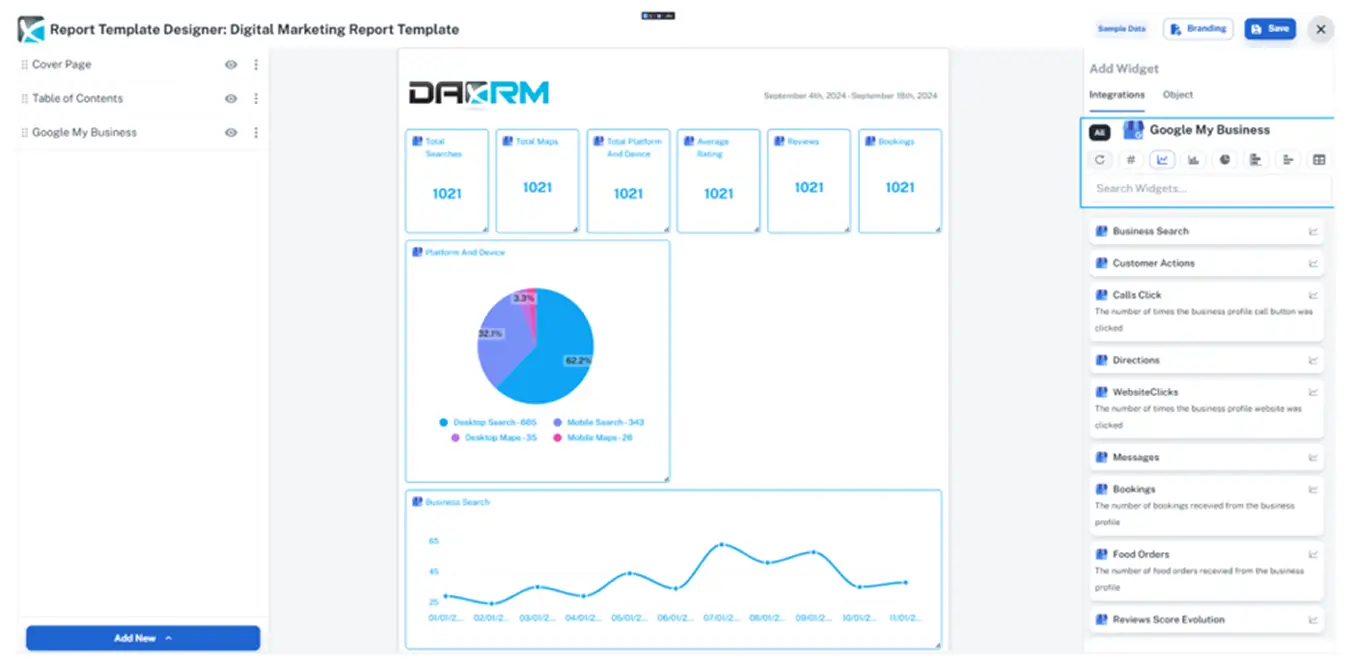
5. Scale Efficiency with a Smart Template Strategy
How do you manage 50 clients without hiring 50 account managers? You standardize.
One of the biggest scalability killers is "custom reporting" where every client gets a unique, handcrafted document. It’s unsustainable. DAXRM allows you to create Master Templates.
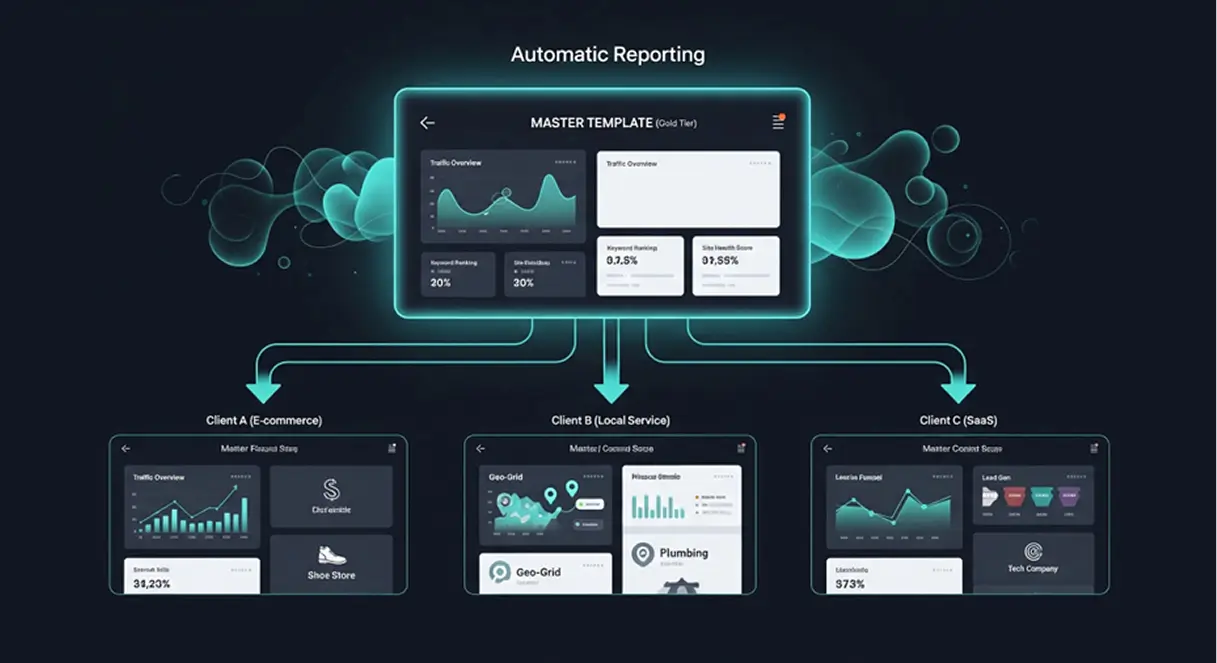
Scalable Template Management
You can build a "Gold Tier SEO Report" template once—pre-loaded with the widgets for Traffic, Rankings, and Site Health—and apply it to 50 different clients in one click. The data populates dynamically for each specific client, but the structure remains the same. This ensures that whether a client is paying $1k or $10k, they get a consistent, high-quality report that looks like it took hours to build, even if it took the system seconds to generate.
Service Tier Enforcement
You can create distinct templates for "Bronze," "Silver," and "Gold" packages. This prevents your account managers from accidentally over-servicing a low-tier client by sending them a 20-page deep-dive report that they didn't pay for. It operationalizes your pricing model directly into your workflow.
Frictionless Client Onboarding
With Master Templates, you can generate a "Baseline Audit Report" for a new client literally minutes after adding their URL to the system. This allows you to deliver a "quick win" and validate their purchase decision on Day 1, rather than making them wait a month for their first update.
Real-Life Use Cases: What This Looks Like in Practice
Theory is great, but how does this actually work when you have 50 unread emails and a client on line one? Here are three common agency scenarios and how DAXRM solves them.
Scenario A: The "Local Franchise" Reporting
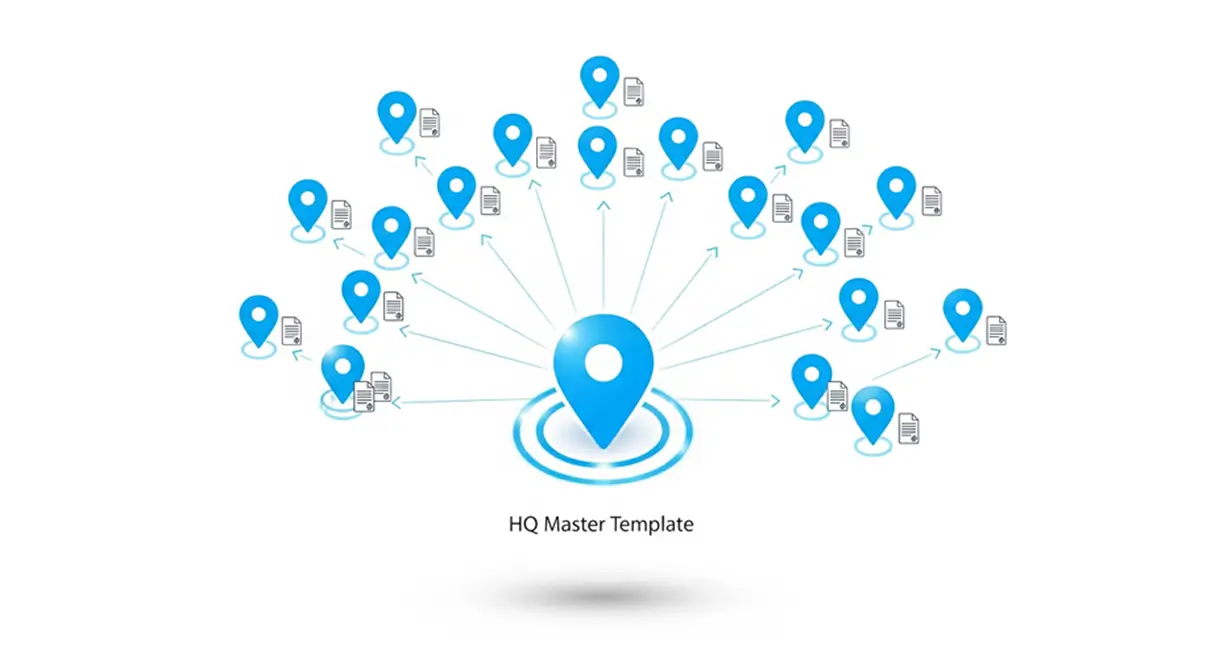
The Situation: You just signed a plumbing franchise with 20 locations across three states. They want monthly reports for each location, plus a roll-up summary for the HQ. Doing this manually would require opening 21 different spreadsheets.
The DAXRM Fix:
- Step 1: You create a "Project Group" called "Plumber Franchise" and add all 20 domains.
- Step 2: You build one Master Template focused on Local SEO (Maps, Calls, Reviews).
- Step 3: You assign that template to the entire group.
- The Result: The system automatically generates 20 individual location reports and sends them to the local managers, while you use the "Project Overview" to send a single aggregate health score to the CEO. You just turned 2 days of work into 20 minutes of setup.
Scenario B: The "Full-Stack" E-Commerce Agency
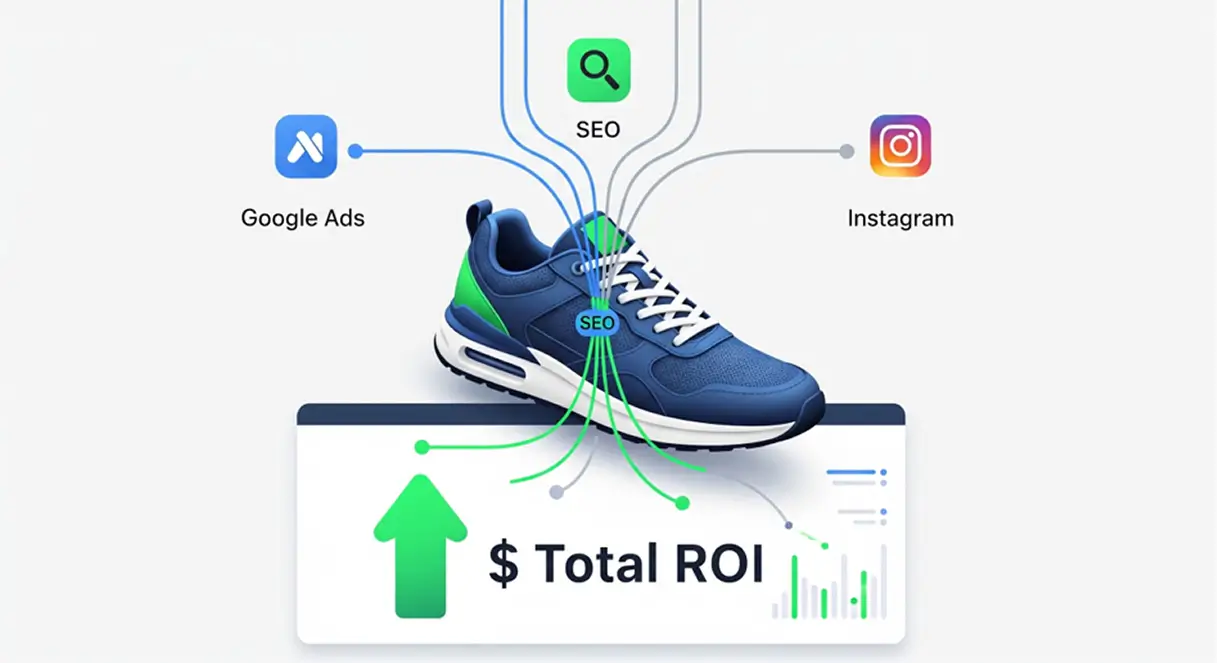
The Situation: You have a client selling sneakers. You are running their Google Ads, doing their SEO, and managing their Facebook content. They are frustrated because they get three different reports from three different account managers, and they can't see the "Big Picture."
The DAXRM Fix:
- Step 1: You use the Drag-and-Drop Builder to create a "C-Suite ROI Report."
- Step 2: You place the Google Ads "Cost/Conversion" widget directly next to the Organic Traffic graph.
- Step 3: You add a custom text block explaining how the organic blog posts (SEO) are building the retargeting audiences for the paid ads (PPC).
- The Result: The client finally sees how the channels work together. They stop asking to cut the SEO budget because they can visually see how it feeds their paid revenue.
Scenario C: The Two-Person Agency Scale-Up
The Situation: You are a two-person agency, but you are pitching a contract worth $5k/month against a much larger firm. You are worried you look "too small" to handle their security and data needs.
The DAXRM Fix:
- Step 1: You set up the White Label Client Portal on portal.youragency.com with your logo and brand colors.
- Step 2: You create a "Login" button on your agency’s main website that redirects to this portal.
- Step 3: During the pitch, you don't send a PDF; you give them a live demo of "Your Proprietary Dashboard."
- The Result: The client assumes you have an in-house engineering team and a sophisticated tech stack. The perceived value of your service triples instantly, allowing you to close the deal at the premium rate.
Final Thoughts: Report for Retention
Reporting shouldn't be an afterthought. It is the only tangible product your client sees for the invisible work you do all month. By automating it, you save your sanity. By integrating it, you prove your value. And by branding it, you build an agency that looks unmatched in the market.